Project Database

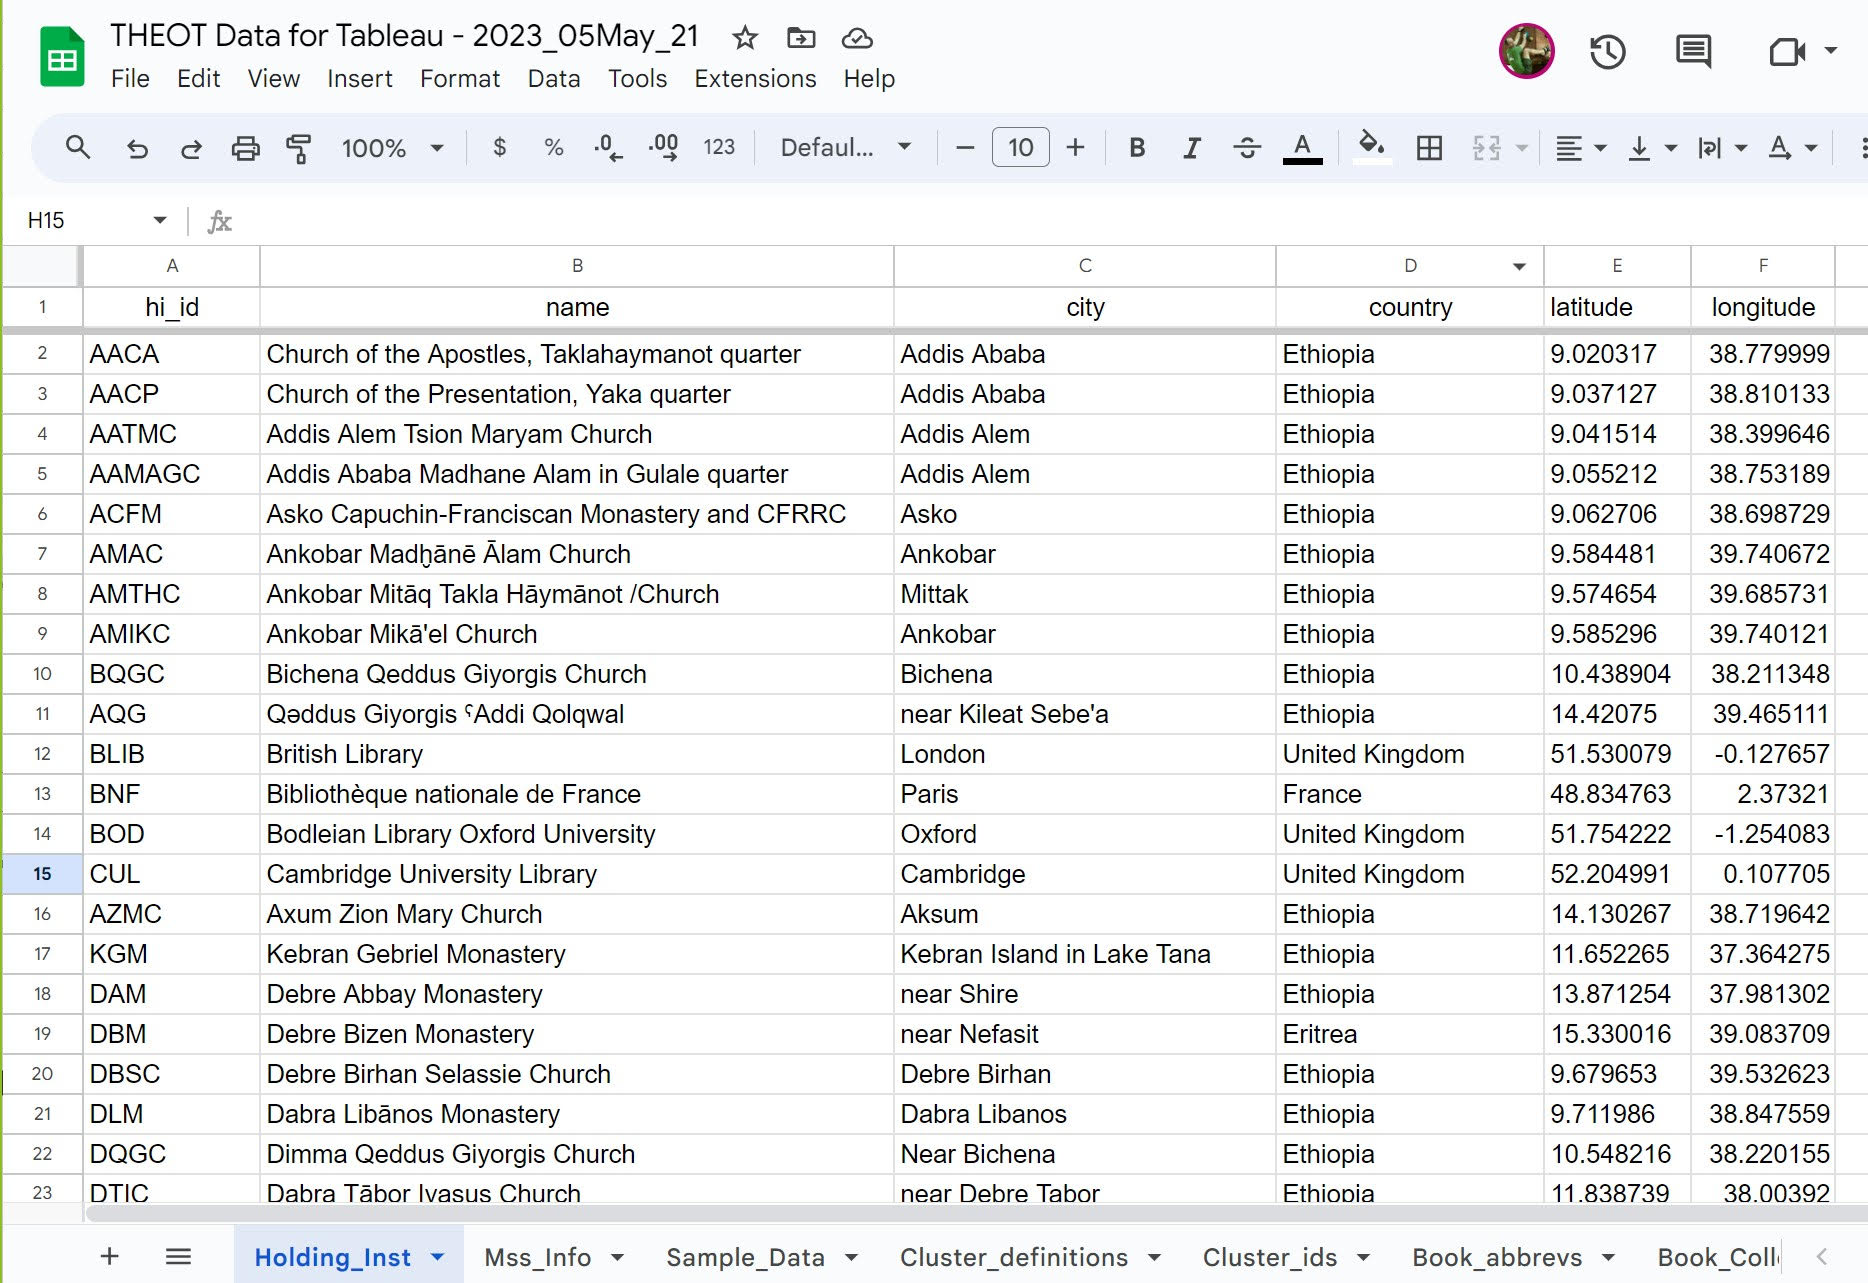
This tab is organized by holding institution. It contains information regarding the institutions that hold the manuscripts used in this study. These include columns for a unique “holding institution identifier” (hi_id), the name of the institution, city, country, and columns for latitude and longitude.

  • Linking data with other tabs: The holding institution identifier serves as the link by which data from other tabs can be connected with data about the holding institutions and their locations.
  • Labels, data, and rollovers: The data columns with institutional names, city, country are ideal for lables, data content, and rollovers in visualizations.
  • Latitude and longitude: These columns enable visualizations laid out on maps

This tab is organized by manuscript. It contains information regarding the manuscripts used in the study. These include columns for a unique “manuscript identifier” (ms_id), primary and secondary sigla for the manuscripts, the holding institution identifier, and various columns relating to a description of the the dating of the manuscript.

  • Linking data with other tabs: The manuscript identifier serves as the link by which data from other tabs can be connected with data about the manuscripts.
  • The column that lists the holding institution id provides a direct path to the holding institution information.
  • Labels, data, and rollovers: The data columns with manuscript sigla, and information about dating are ideal for organizing the data in chronological visualizations, as well as for rollovers and labels.

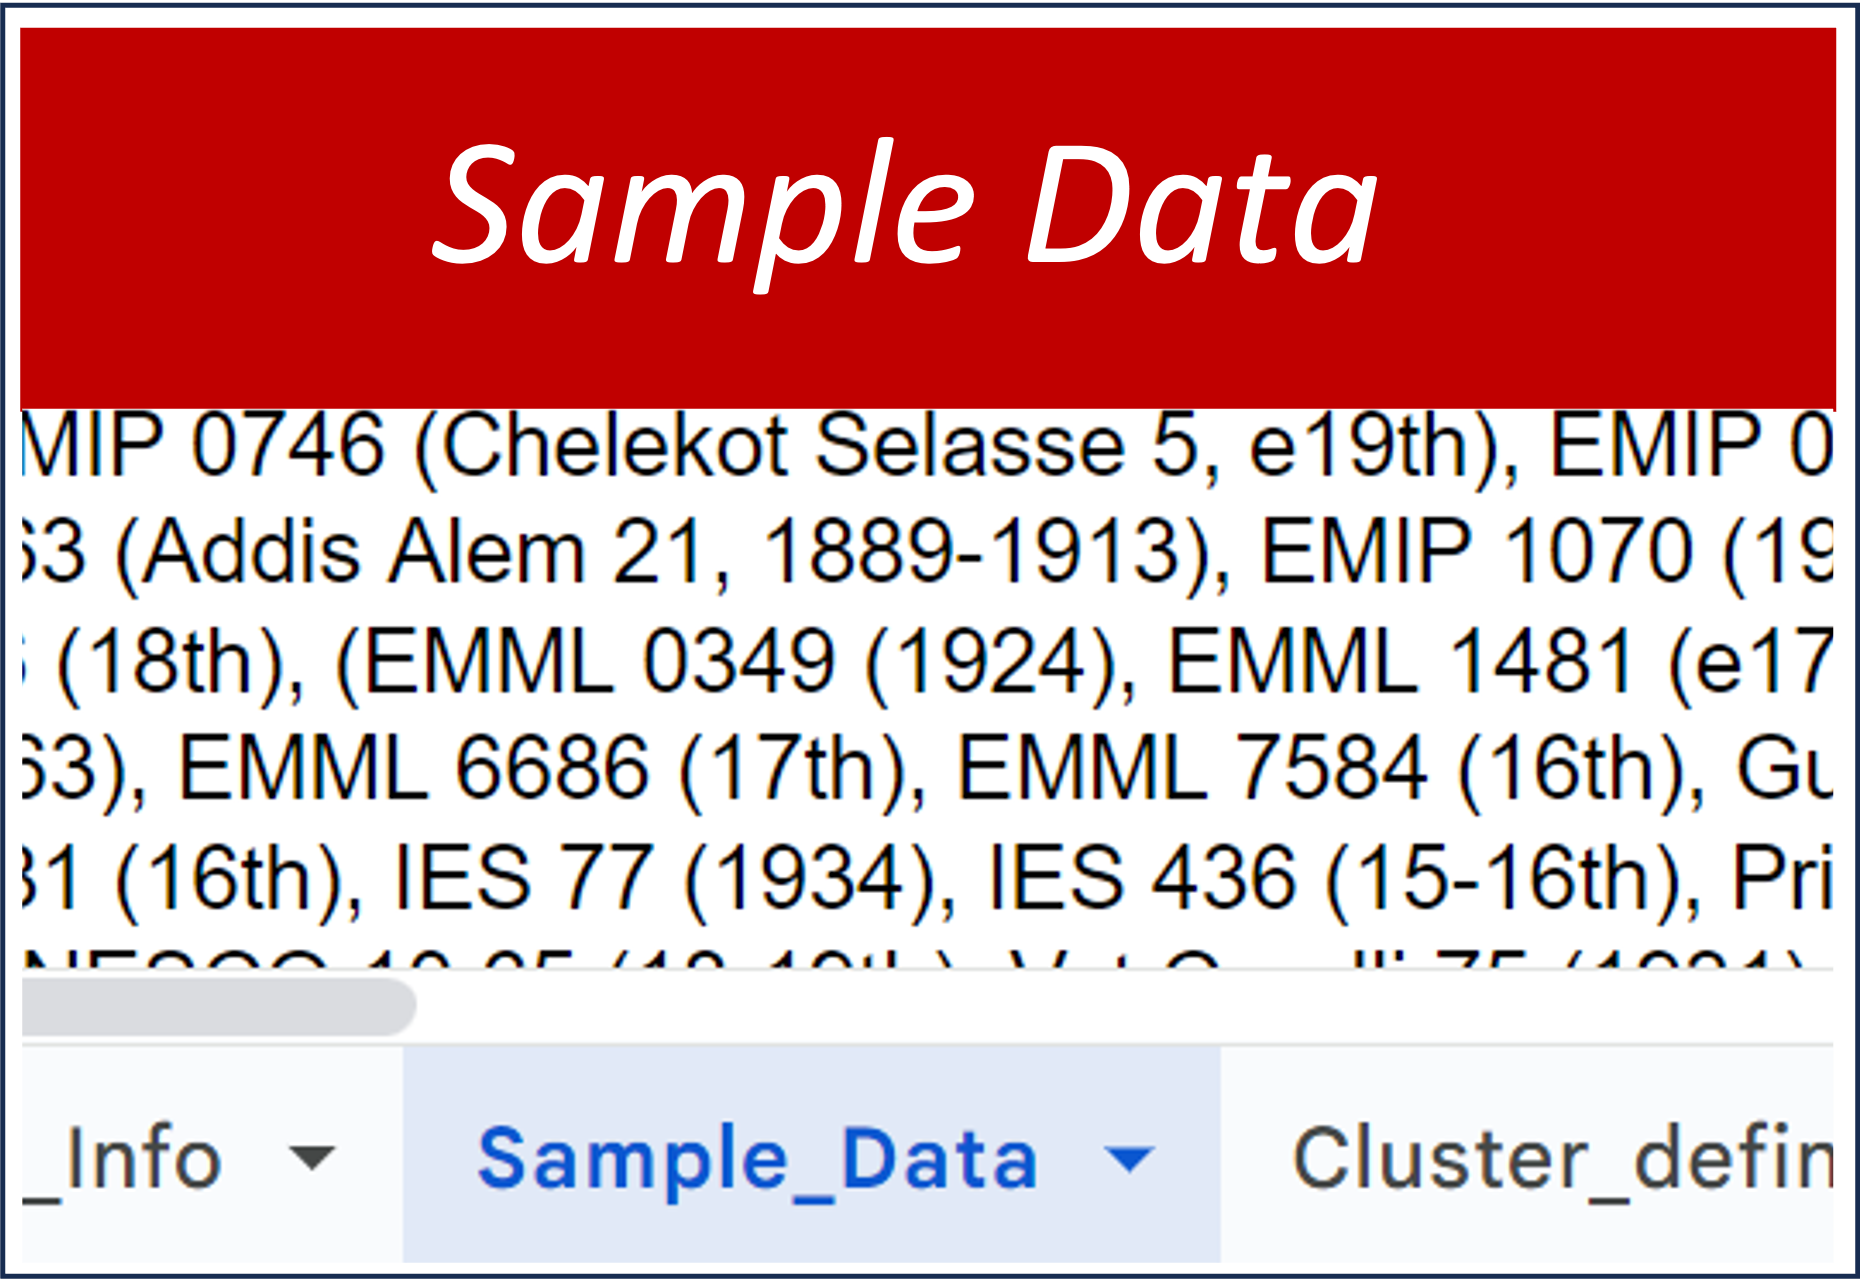
This tab is organized by book of the Ethiopic Old Testament (book_id). Each of the following columns contains information about the sample of manuscripts used in the THEOT study and about the extent of the text transcribed for the study. These include columns identifying the book under study, the number of manuscripts, a list of the specific manuscripts used, number of words in the base text of the sample, the total words in the book, the total number of words in the sample, the calculated percentage of the book in the sample of the study, the number of data rows, the total number of data points represented by the number of manuscripts multiplied by the number of words in dots and bars grid.

  • Linking data with other tabs: By linking to this tab’s book_id one can either pull out data on a specific book from other spread sheets, or distinguish data in a tab that contains comingled data about multiple books.
  • The column that lists the holding institution id provides a direct path to the holding institution information.
  • Labels, data, and rollovers: The data columns regarding numbers and lists of manuscripts, sample passages, percent of the book transcribed, and information about data points are ideal for lables, data content, and rollovers in visualizations.

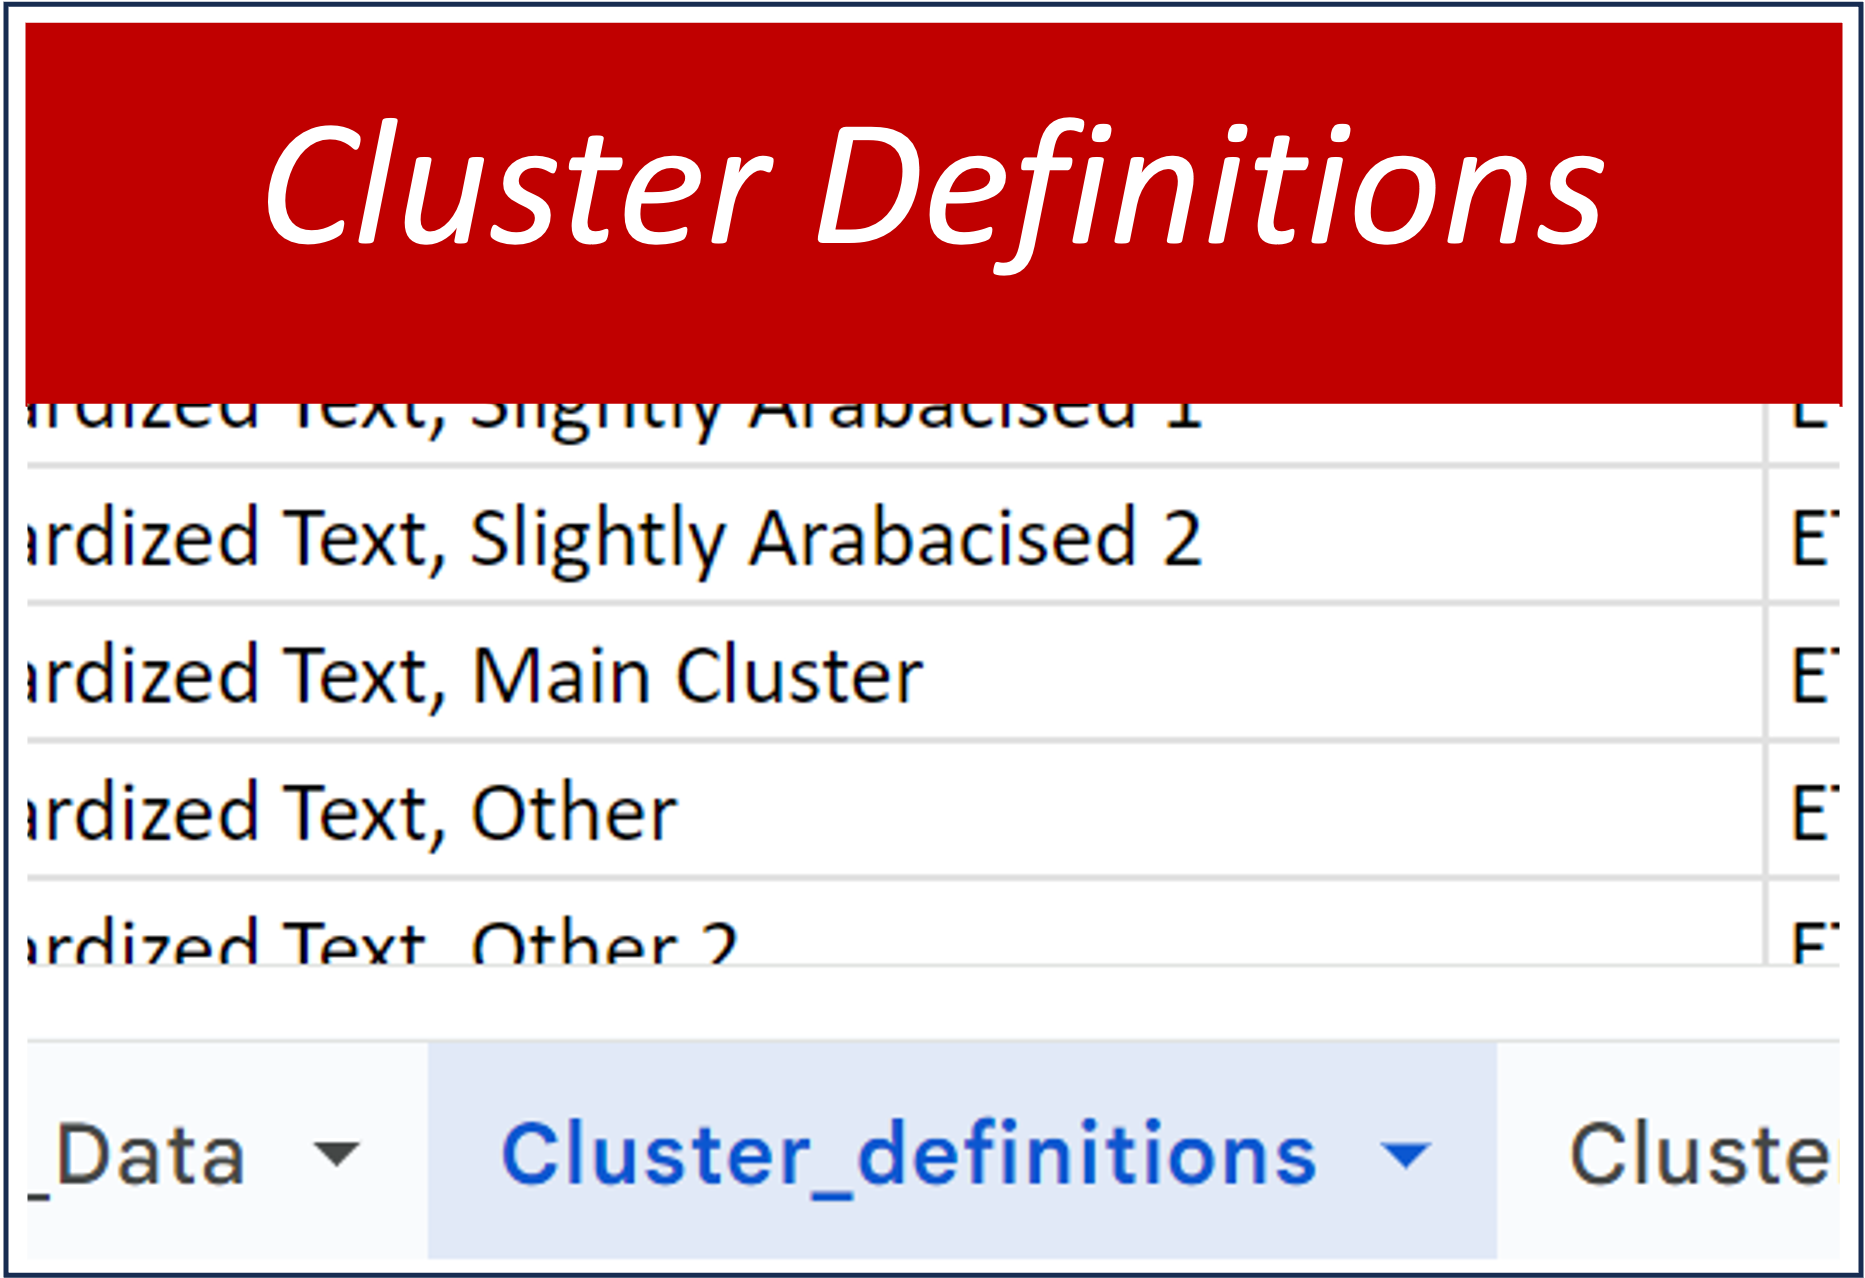
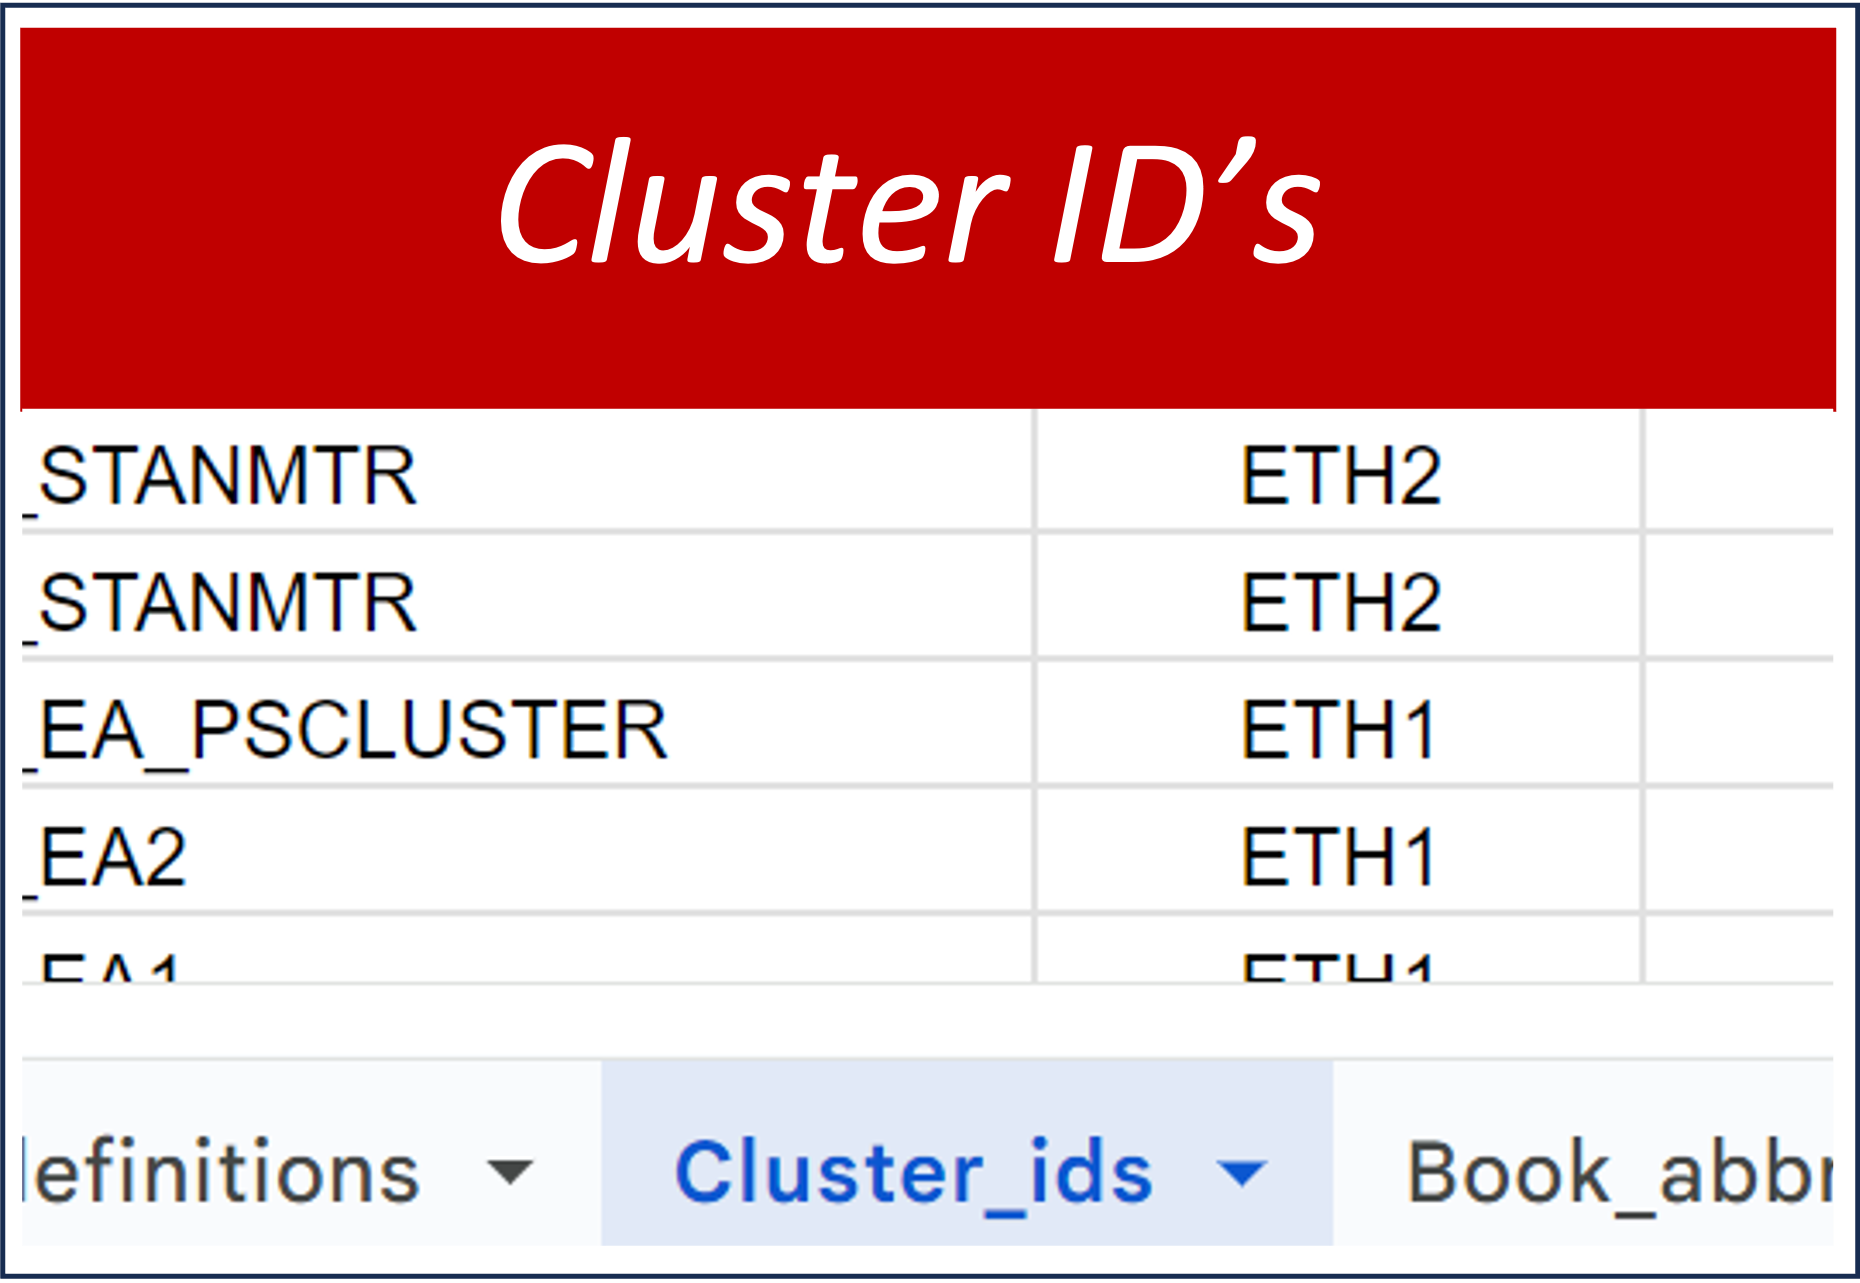
This tab is a definition table that sets forth a naming convention for cluster identification (clus-id) and various ways of describing the clusters. These are used to designate the cluster membership in a specific old testament book for the various manuscripts in our study. In the next tab, the specific manuscripts will be labeled with the cluster definition appropriate to the book being studied.

This tab is organized to provide information about the clusters to which the various manuscripts belong in each book study. The primary columns provide book_id, ms_id, and clus_id. Secondary columns indicate witness number (witness_no) and cluster number (cluster_no), which are book specific, i.e., not uniform from book to book.

  • Linking data with other tabs: The ms_id column facilitates linking with the manuscript information tab and all of its columns of data. The book_id column facilitates linking this datasheet to the book abbreviations tab, which enables the selection of book specific information out of other tabs.
  • Labels, data, and rollovers: The clus_id column provides the fundamental information about cluster membership. The text_epoch column provides a basic distinction between the periods known as EthI (14-16th centuries) and EthII (17th-20th centuries). These are ideal for labels, data content, and rollovers in visualizations.

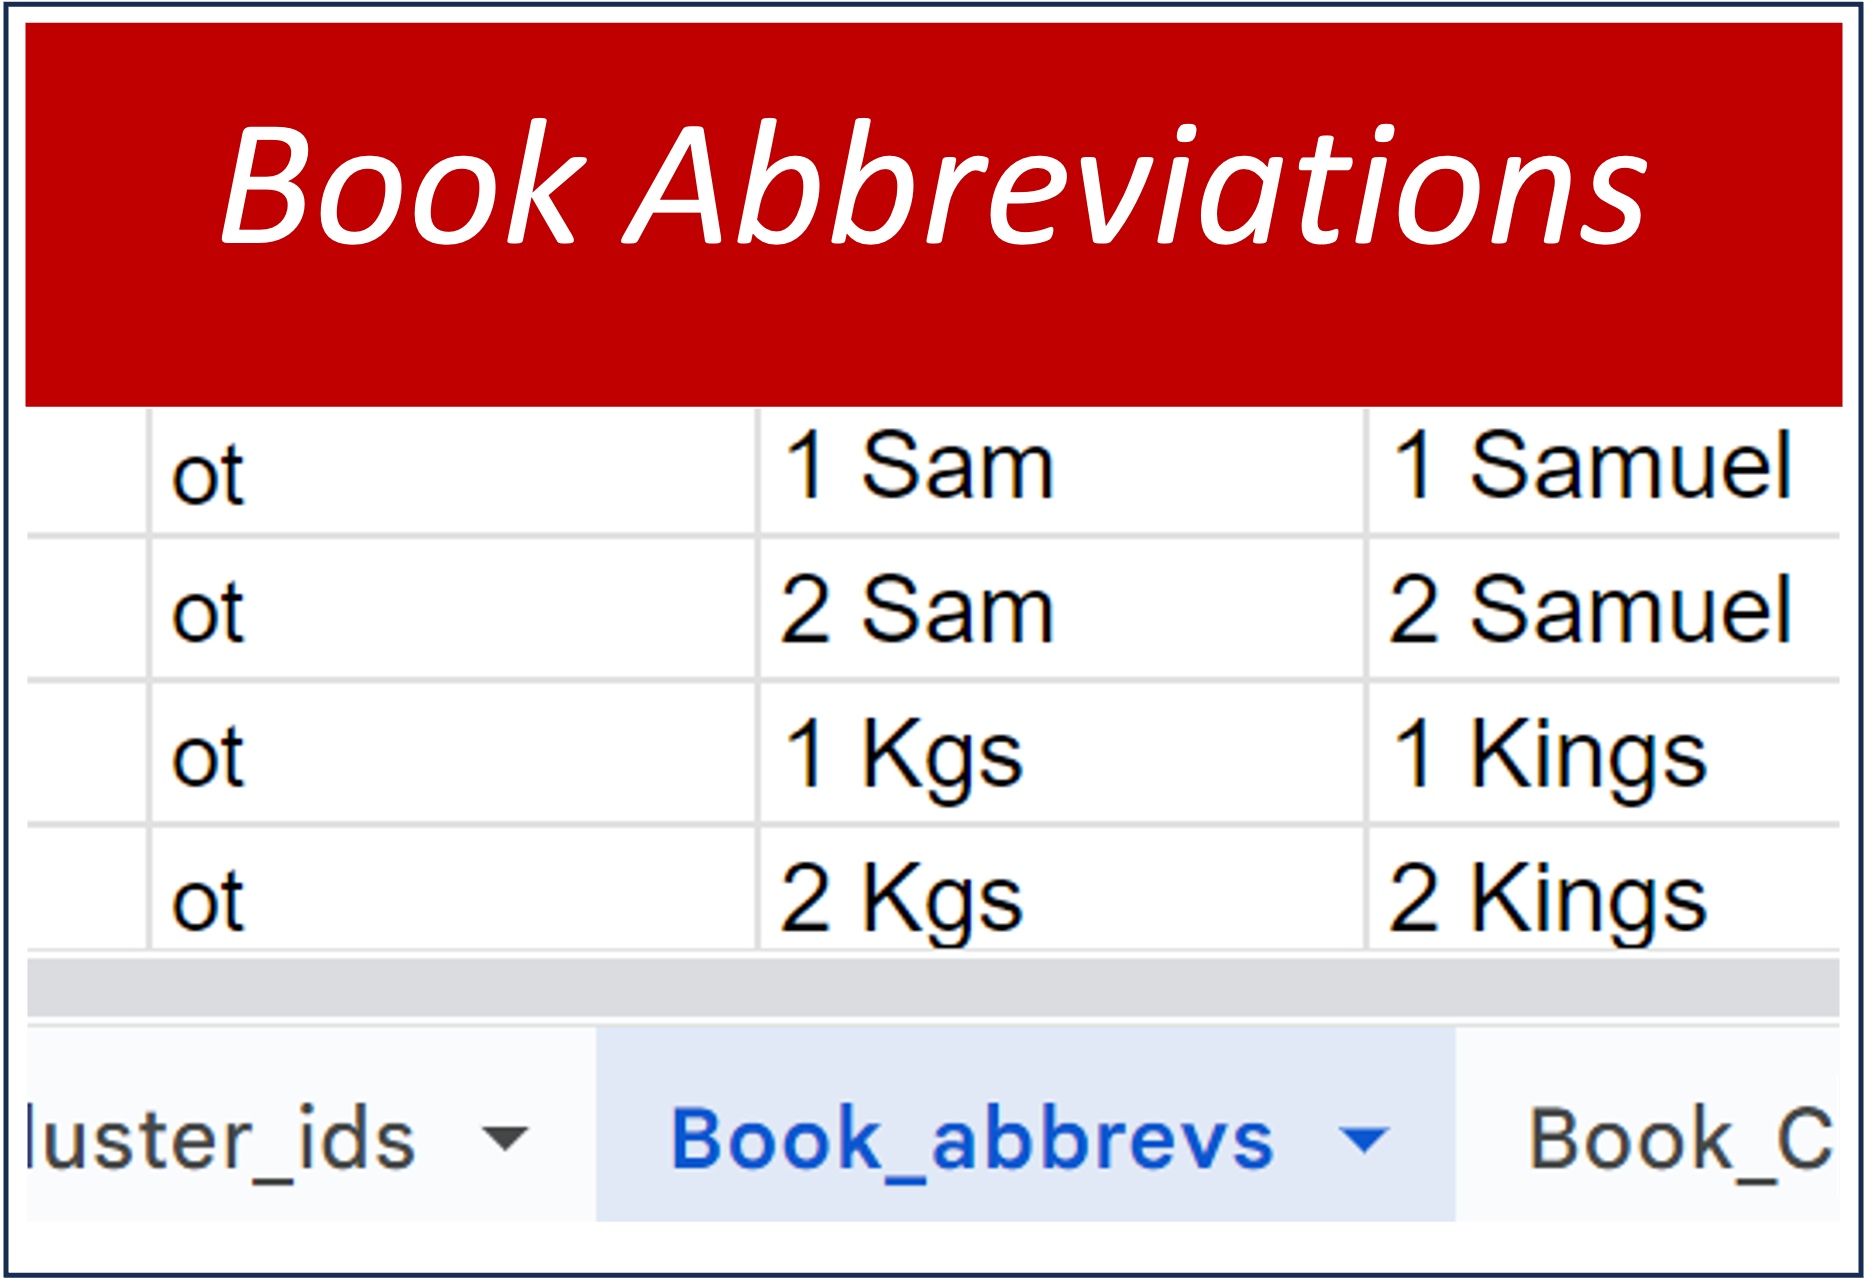
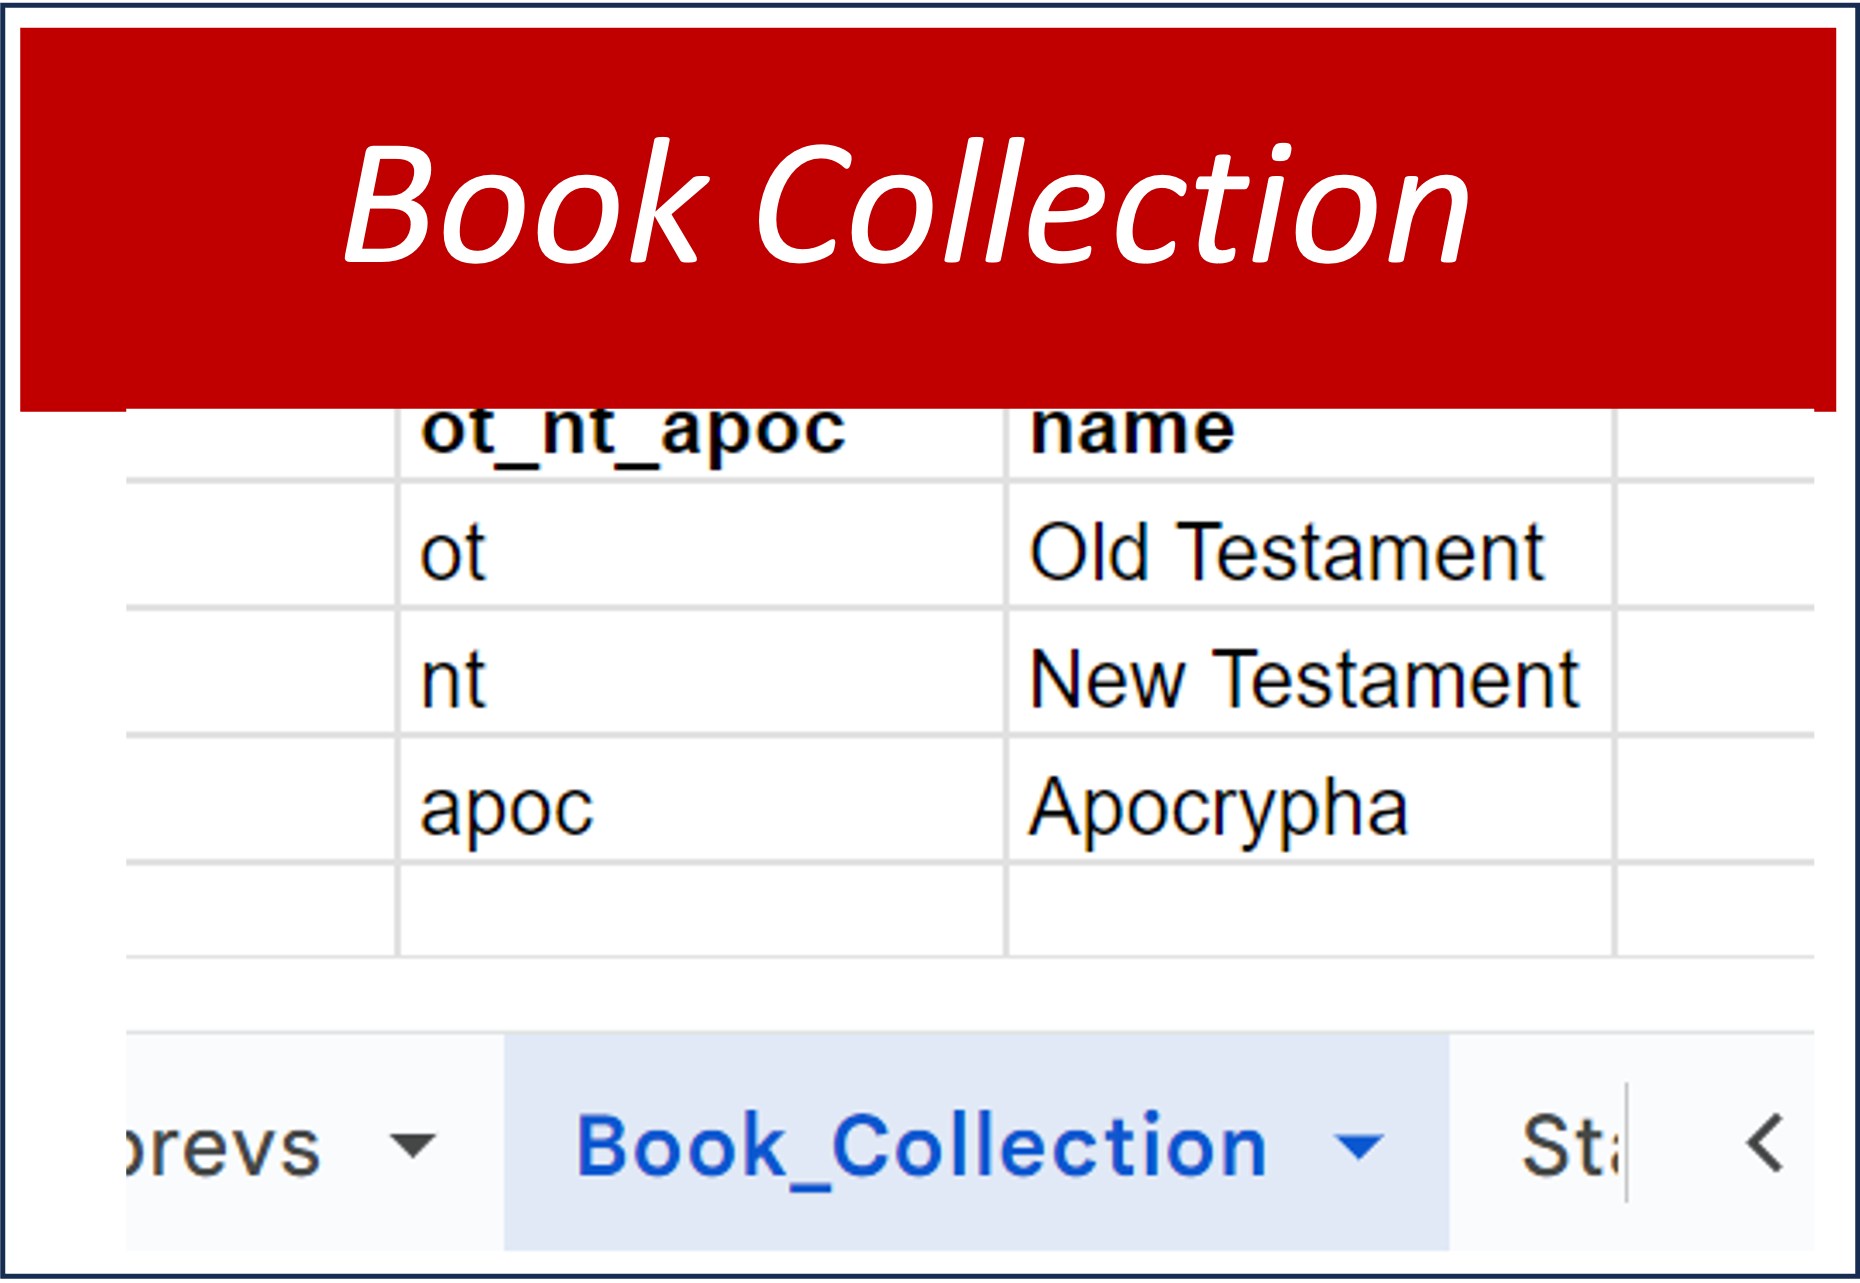
This tab is also a definition table. It provides the standard SBL abbreviations for the books of the bible, which we have adopted for our work and data. These are clarified further with columns indicating membership in the conventional canonical categories of Old Testament New, Testament or Apocrypha.

  • Linking data with other tabs: As a definition table, these columns provide the means to differentiate or aggregate any of the book_id columns in any of the other data tabs.

This tab is another definition table which simply provides a fast and easy approach to grouping data under these headings .

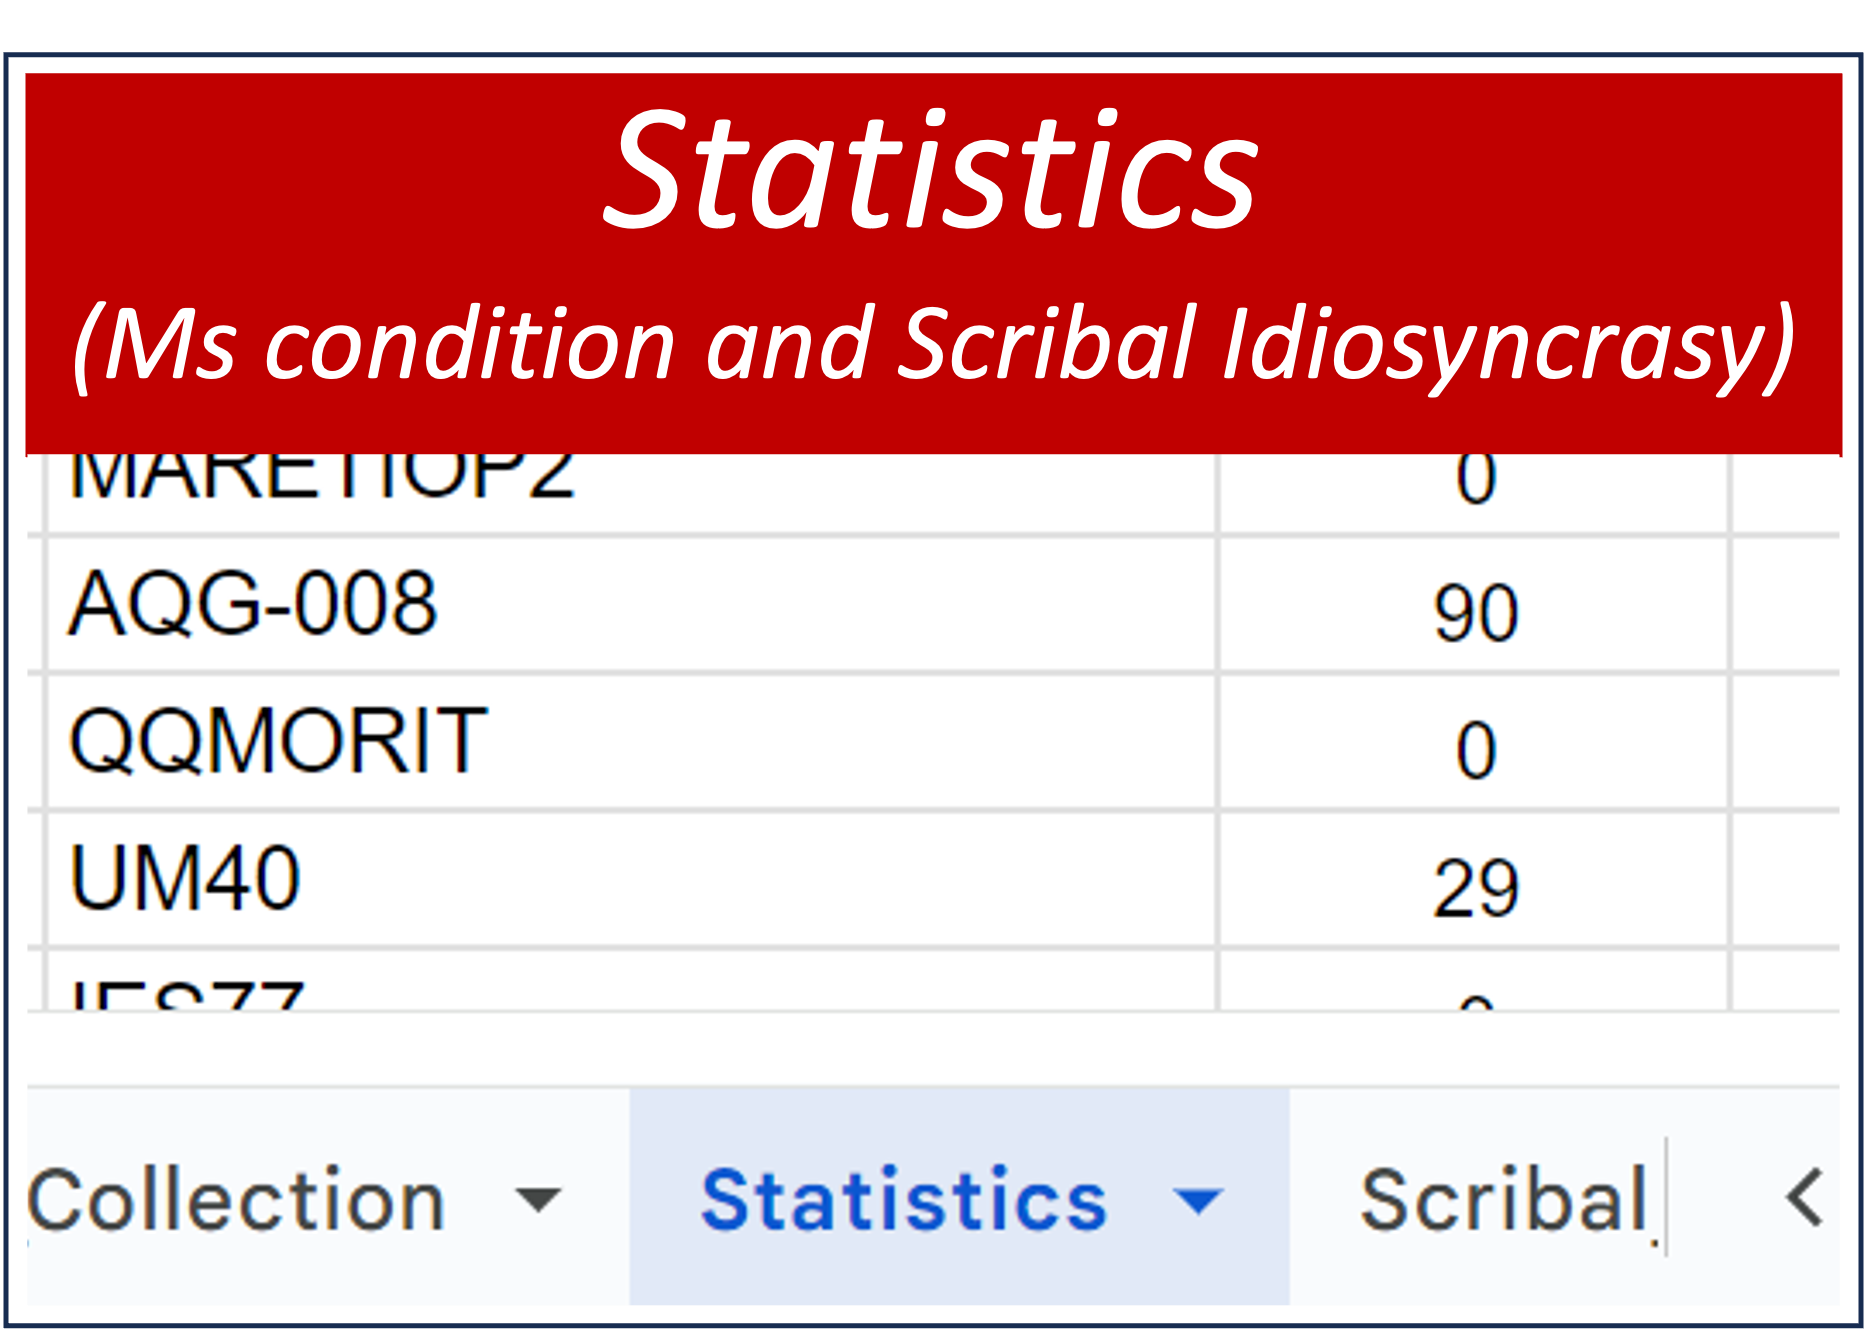
This tab contains detailed statistical information related to two things: 1) manuscript condition (i.e., the presence, absence, and/or legibility of text in a manuscript); and 2) scribal idiosyncrasy.

  • Linking data with other tabs: The statistics tab is organized around the book_id column and the manuscript id columns. As such these columns are fast and easy links to columns in other tabs and to the data they contain.
  • Labels, data, and rollovers: The key data related to manuscript condition is to be found in the total_zeros column. In the cases of manuscript condition, zeros define specific locations in the manuscript where text was missing or undecipherable ( This data is a means of quantifying the condition of the manuscripts stated in terms of the number of words missing in the manuscript. The percent_zeroes column states the same information in percentage terms. The key data related to scribal idiosyncrasy is found in the columns related to various categories of unique readings )total number of unique readings, percent unique readings, total unique minuses, total unique plusses, and percent unique plusses. These are ideal for labels, data content, and rollovers in visualizations

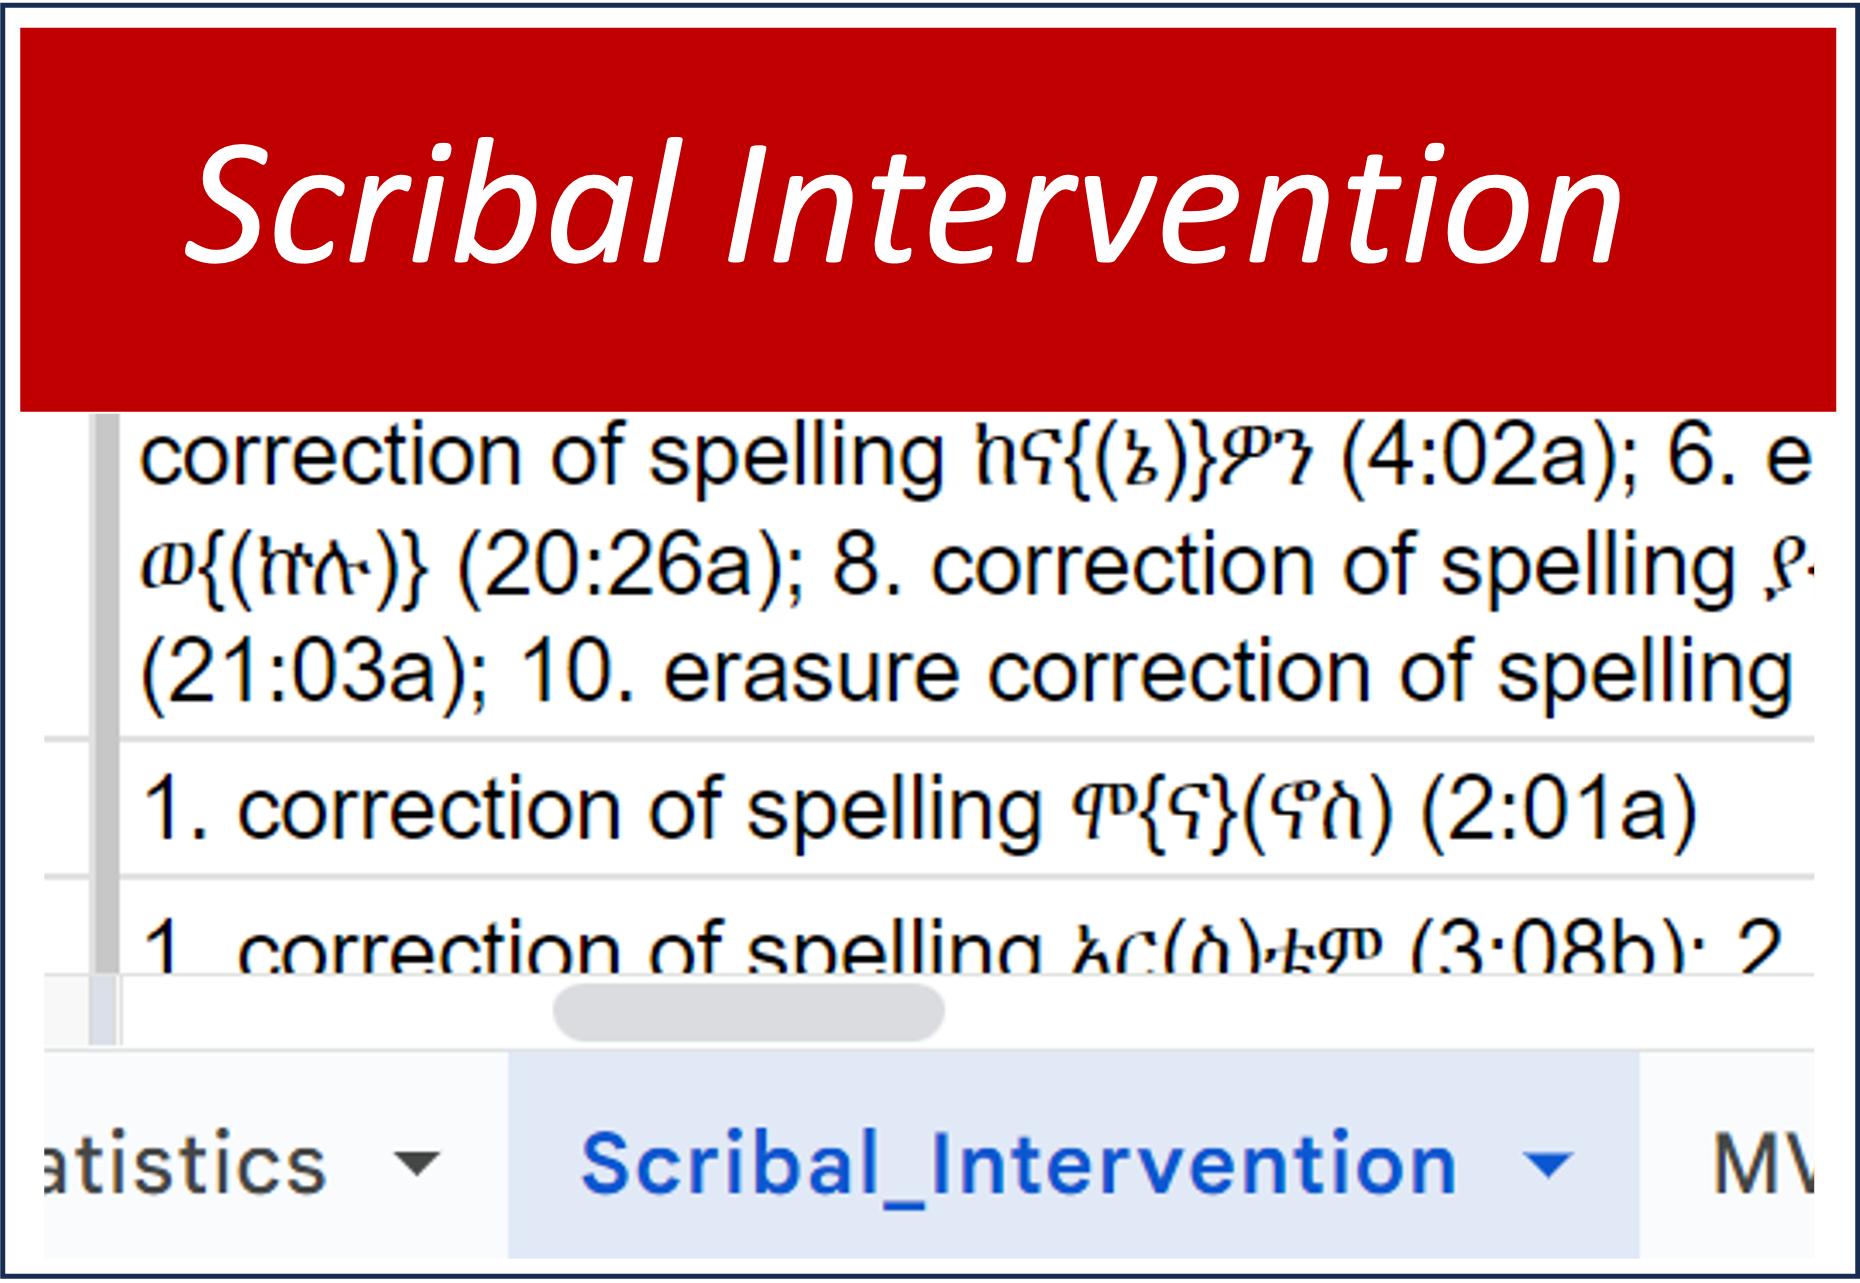
This tab contains detailed statistical information related to the interventions by secondary hands to change and correct perceived errors. The columns provide information on the quantity and details of the interventions specific to each manuscript in the study. This category of data is exploratory and has been carried out on only one book (Judges), but provides a proof of concept for the idea of visualizing the phenomena of scribal intervention.

  • Linking data with other tabs: The statistics tab is organized around the book_id column and the manuscript id columns. As such these columns are fast and easy links to columns in other tabs and to the data they contain.
  • Labels, data, and rollovers: The key statistical data is specified under three headings indicating they number of different types of interventions (to change, to add, to correct). Two additional columns specify the total number of interventions and number of erasures. Descriptions of the actual philological data are listed in a final column. This information is useful for data display and rollover tip text.

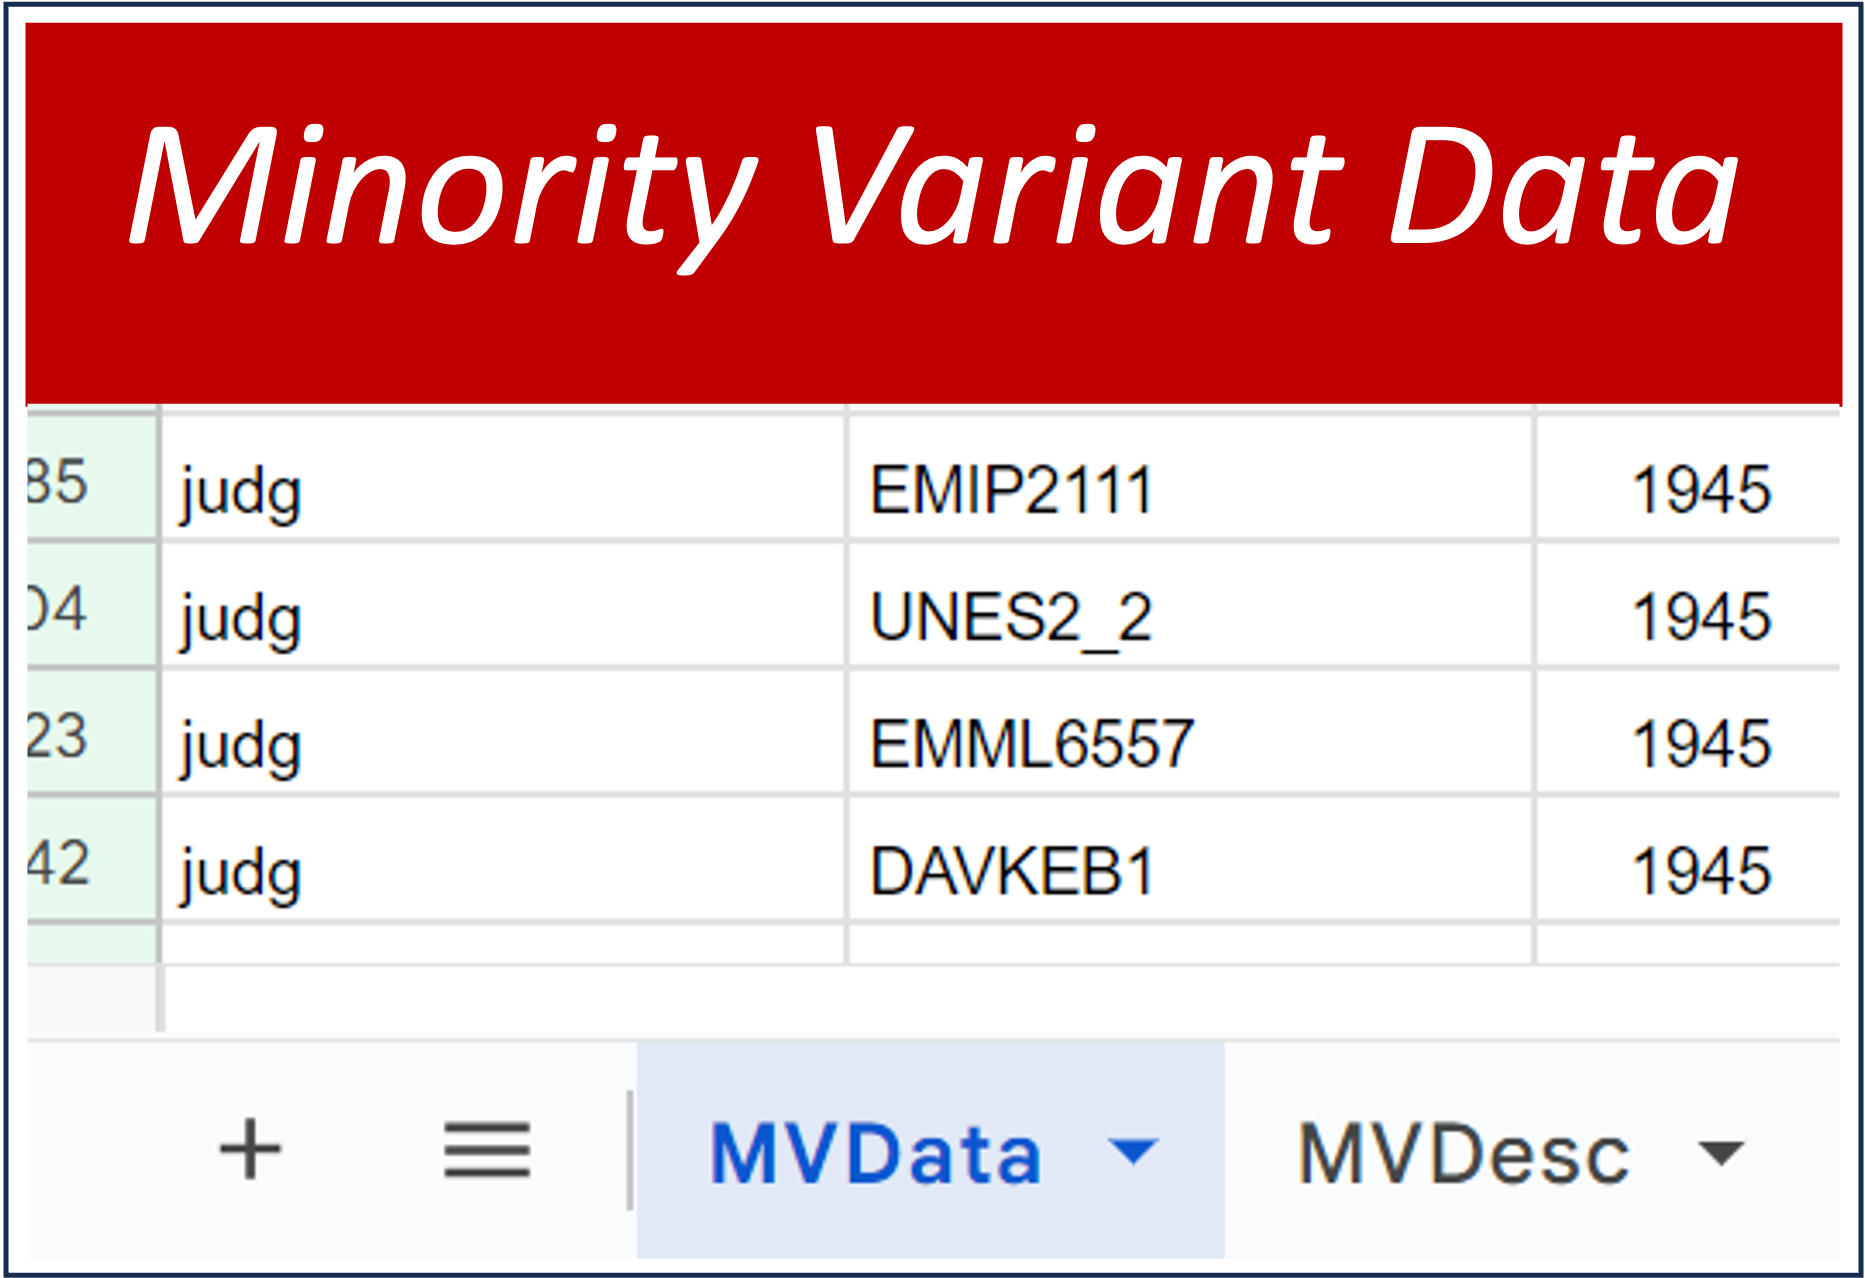
This tab, on Minority Variant Data, and the next one, on Minority Variants Descriptions, contain detailed statistical and philological information about shared minority variants among the manuscript copies of a book. This tab is organized around book id, manuscript id, and the presence or absence (specified by a one or a null) of minority variants in specific columns of the dots and bars text matrix.

  • Linking data with other tabs: The minority variant data tab is organized around the book_id column and the manuscript id columns. As such these columns are fast and easy links to columns in other tabs and to the data they contain. The patterns of shared minority variants can also be correlated with the tab identifying cluster membership of each manuscript. In this way we can detect cluster behavior in relation to the minority variants.
  • Labels, data, and rollovers: The only column with actual data in it is the one that contains a one if the minority variant was present at the specific location. But when aggregated correctly in a visualization, these make it possible to see much more clearly the patterns of shared variation that are going on among the manuscripts.

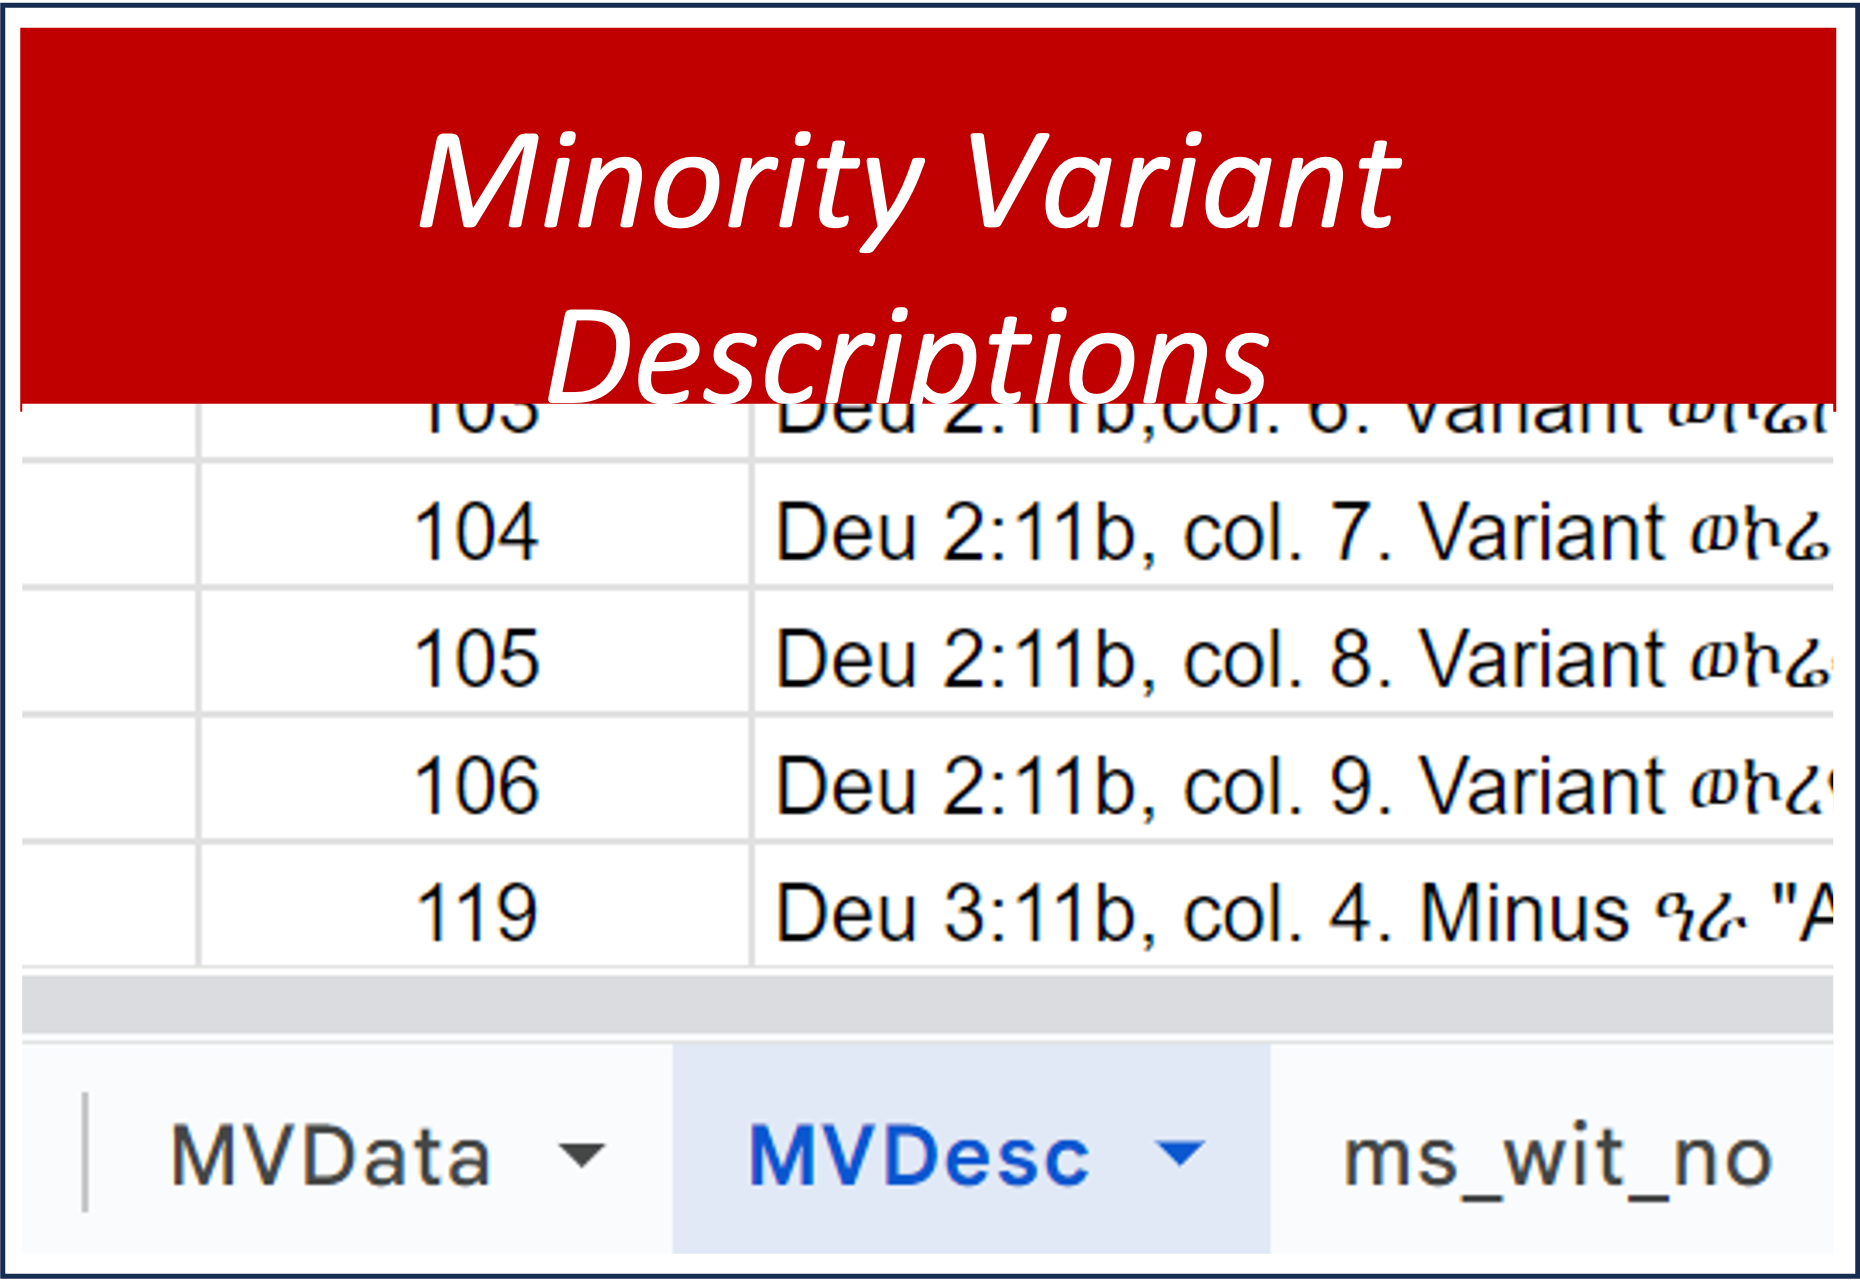
This tab, on Minority Variant Descriptions, goes with the previous one on Minority Variant Data. Whereas the previous tab contained only statistical information about the presence or absence of a minority variants, this tab provides only the listing and description of the minority variants. This tab is organized around book id, and tvu number. But the column labeled tvu specifies a locus where multiple manuscfripts share a particular minority variant. The most important column, then, is the one labeled minority variant description (mv_desc) a description of the minority variant itself.

  • Linking data with other tabs: The minority variant data tab is organized around the book_id column and the manuscript id columns. As such these columns are fast and easy links to columns in other tabs and to the data they contain. The patterns of shared minority variants can also be correlated with the tab identifying cluster membership of each manuscript. In this way we can detect cluster behavior in relation to the minority variants.
  • Labels, data, and rollovers: : The only column with actual data in it is the one that contains a one if the minority variant was present at the specific location. But when aggregated correctly in a visualization, these make it possible to see much more clearly the patterns of shared variation that are going on among the manuscripts.

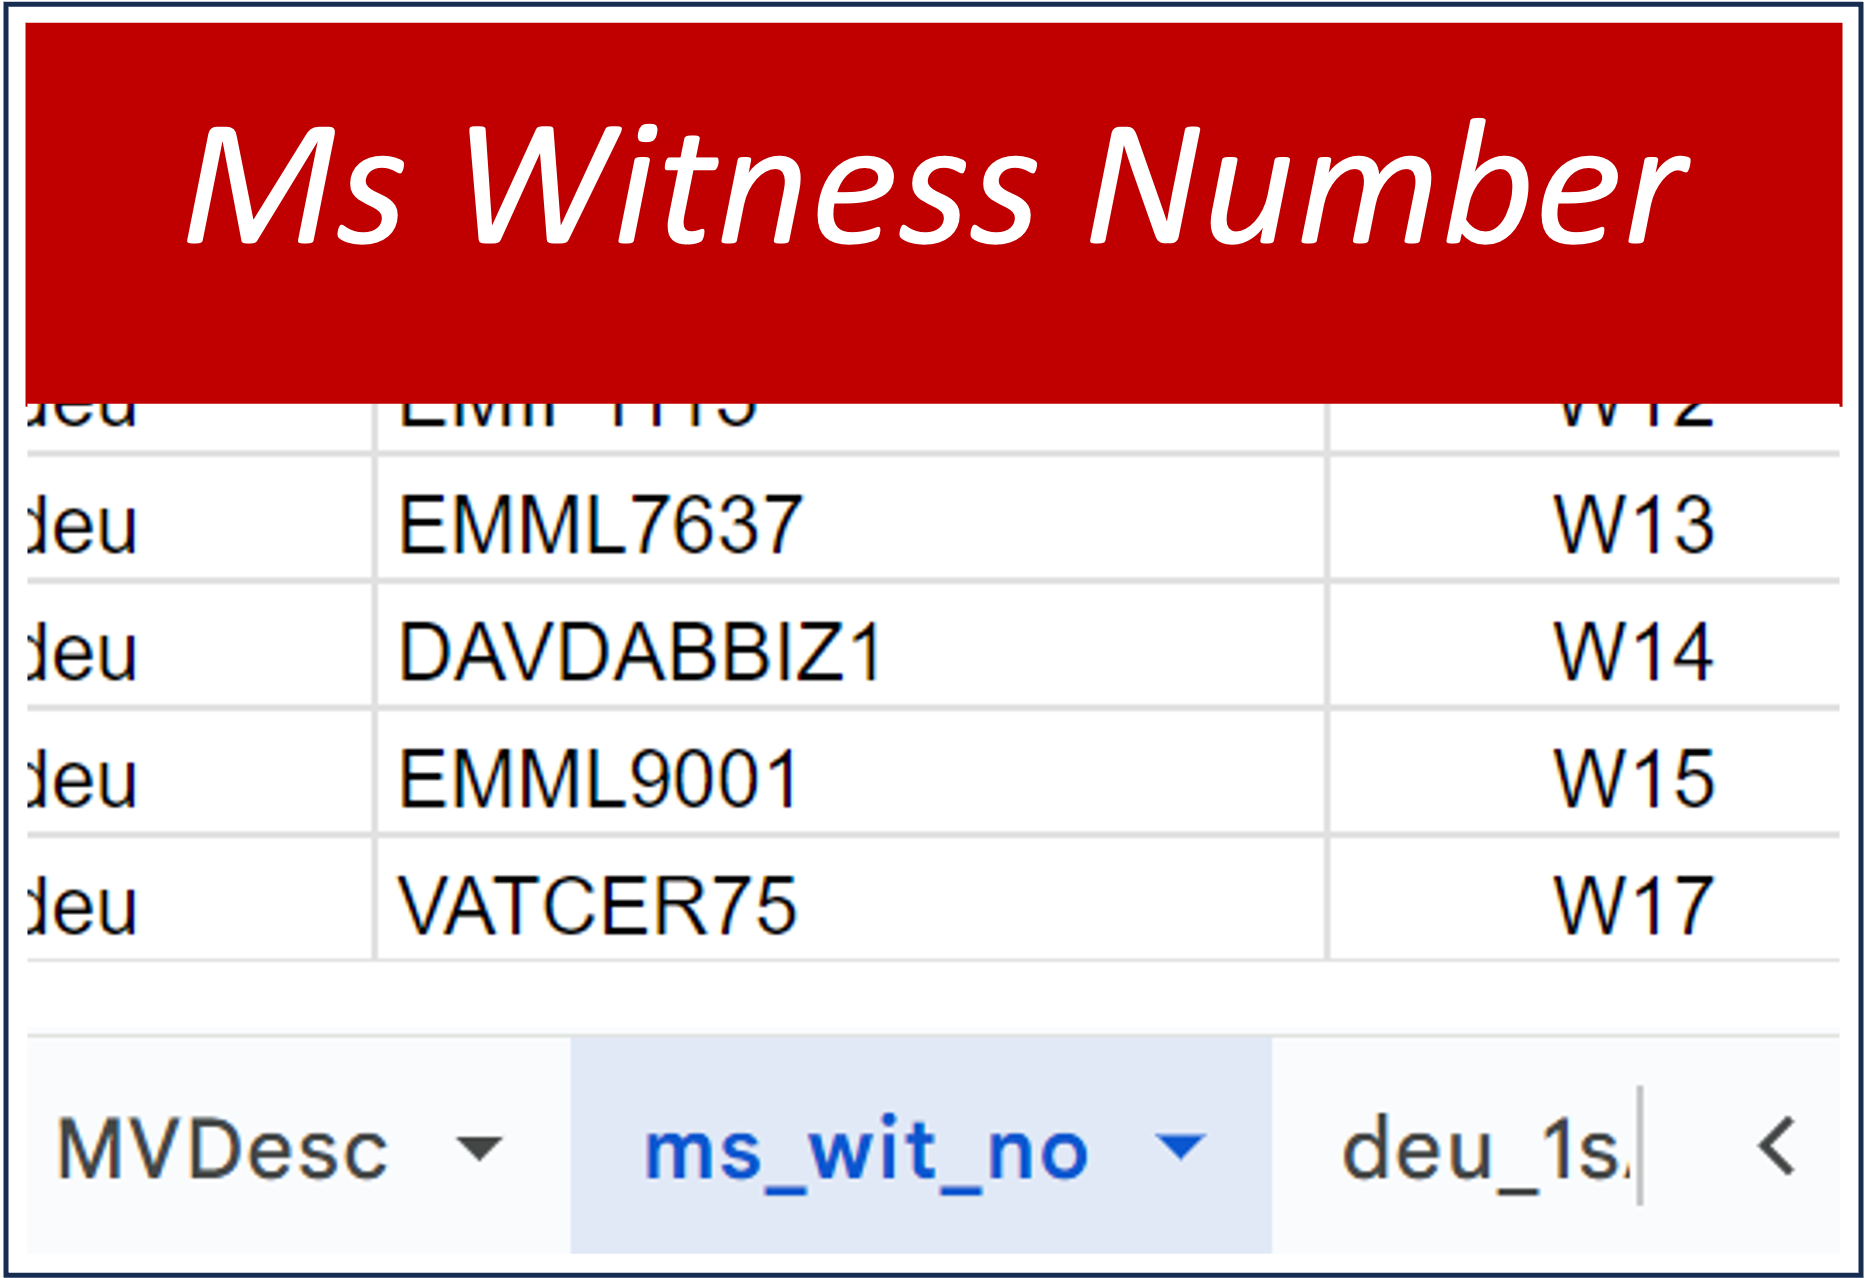
This tab merely specifies the witness number assigned to each manuscript in the study. Since there is no consistencey maintained around which manuscripts are assigned which witness number, this information has no significance beyond the specific book it is in. It is, however, useful to be able to correlate manuscript sigla with witness number for each book study.